Paradise Coast Tourism Scorecard: Collier Turned the Corner in Season. The Summer Report Will Tell Us If It Held.
By Brian French | NaplesBusinessNews.com | September 3, 2026
Fifth installment in the Florida Authority Network’s Naples market-index series. The Scorecard is republished on this URL each quarter after the Tourist Development Council receives the Downs & St. Germain visitor report. Next update: after the April–June 2026 report is presented.
Quick Answer
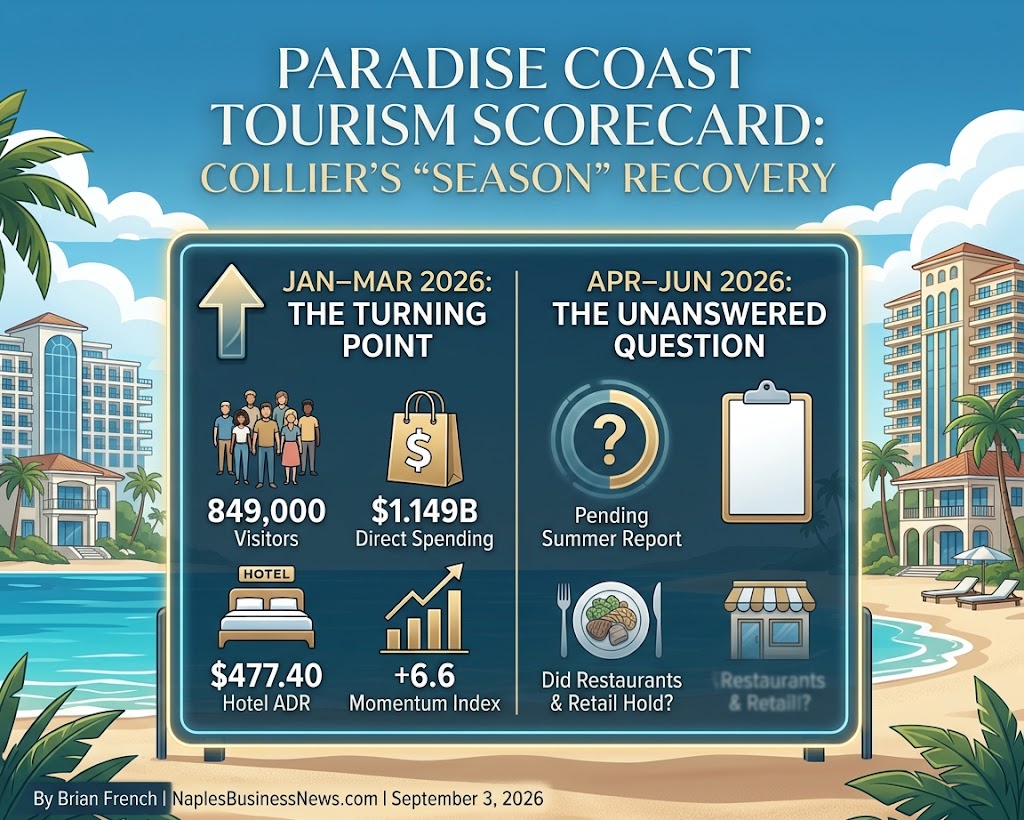
Collier County tourism posted its first clean sweep in two years during the January–March 2026 peak season. Visitation rose 5.5% to 849,000, direct visitor spending rose 8.5% to $1.149 billion, hotel average daily rate climbed 9.2% to $477.40, occupancy reached 75.9%, and revenue per available room was up nearly 8%. Every metric the county tracks improved over the same quarter of 2025. The Florida Authority Network’s Paradise Coast Momentum Index, an average of year-over-year change across the five headline lodging and spending measures, reads +6.6 for the quarter, up from roughly +1.7 in October–December 2025 and about −1.0 in the April–June 2025 trough. The recovery is real, it is domestic, and it is being carried by rate rather than volume. The open question is whether it survived a summer without season pricing; that answer arrives with the April–June report.
The Scorecard
Collier’s fiscal year begins October 1, so the county’s “second quarter” is the calendar first quarter and the peak season. The Scorecard uses calendar quarters for clarity.
| Metric | Jan–Mar 2026 | Change vs. Jan–Mar 2025 | Oct–Dec 2025 | Change vs. prior year | Direction |
|---|---|---|---|---|---|
| Visitors | 849,000 | +5.5% | 667,200 | +0.7% | Up, accelerating |
| Direct visitor spending | $1.149B | +8.5% | n/a (Dec: $265M+) | Dec: +$5M | Up |
| Hotel average daily rate | $477.40 | +9.2% | $300.54 | +4% | Up, accelerating |
| Hotel occupancy | 75.9% | +1.7 pts | 62.4% | +0.2 pts | Up |
| RevPAR | — | ~+8% | — | ~+4% | Up |
| Tourist tax collections | March: $7.93M; CYTD $25.9M | March +double digits | $11.1M | +8.6% | Up |
| Domestic visitors | — | +7.1% (Northeast +14.6%) | — | Up | Up |
| International visitors | — | −6.2% (Canada −16.2%) | 79,400 | −14.5% (Canada −20.3%) | Down, narrowing |
| Hotel room supply | — | +1.5% | — | +3% (after +14.3% in FY2025) | Up |
Sources: Downs & St. Germain Research quarterly reports to the Collier County Tourist Development Council (February 10 and May 19, 2026); Naples, Marco Island, Everglades CVB; STR hotel data. Room-night, days-in-market and economic-impact measures also rose in the January–March quarter.
Paradise Coast Momentum Index
The Index averages year-over-year percentage change in five measures: visitation, direct spending, hotel ADR, hotel occupancy (percentage points) and RevPAR. Zero is flat; positive is expansion.
| Quarter | Visitation | Spending | ADR | Occupancy | RevPAR | Index |
|---|---|---|---|---|---|---|
| Apr–Jun 2025 | −2.2% | −4.1% | −1.2% (June) | +3.5 pts (June) | est. ~−1% | ≈ −1.0 |
| Oct–Dec 2025 | +0.7% | ~+2% (Dec) | +4.0% | +0.2 pts | ~+4% | ≈ +1.7 |
| Jan–Mar 2026 | +5.5% | +8.5% | +9.2% | +1.7 pts | ~+8% | +6.6 |
| Apr–Jun 2026 | pending | pending | pending | pending | pending | — |
Where a full-quarter figure was not published, the closest reported monthly figure is used and noted. FAN composite; methodology at end.
The trajectory is the story: from contraction in mid-2025, through a flat autumn, to the strongest peak season since before Hurricane Ian. Joseph St. Germain of Downs & St. Germain told the council that only Key West sustains a comparable combination of $500-plus March rates and mid-70s occupancy.
What is driving it
Rate, not heads. Spending grew faster than visitation (8.5% versus 5.5%) and ADR grew faster still (9.2%). Collier is recovering as a luxury destination that charges more per night, not as a volume market. That is consistent with the profile of the domestic visitor who replaced the lost international traveler: Northeast arrivals were up 14.6%.
Marketing money. The county has spent an extra $10 million on advertising over roughly the past 18 months, and its tourism director credits that stimulus for a fiscal 2025 in which bed-tax collections rose 13% to just under $50 million and tourism supported about 27,500 jobs. The Tourist Development Council nonetheless split 5-4 in May over a fiscal 2027 marketing baseline of $9 million, down from about $11 million, with the chair arguing the cut is too deep to hold momentum.
Group and events. April’s Franklin US Open Pickleball Championships drew more than 55,000 fans and 3,700 players from all 50 states and 53 countries. STR data for April showed hotel leisure demand slipping 1.8% while group demand rose 19%, with more visitors landing in vacation rentals rather than hotels. That mix shift matters for the bed-tax base and for the November referendum on a sixth cent.
Supply absorbed. Room supply grew 14.3% in fiscal 2025 and another 3% since, yet occupancy still rose. Filling a larger inventory at a higher rate is the strongest signal in the data.
The international gap
International visitation has fallen in every reported period since early 2025, led by Canada: down 20.3% in October–December and 16.2% in January–March, after drops above 19% through much of 2025. The county attributes it to exchange rates, airfare and broader travel sentiment rather than anything destination-specific, and all other international markets posted gains in the most recent report. Europeans remain the largest overseas segment at roughly 6% of visitors, with Canadians around 4%. The decline is narrowing, but the winter of 2026–27 will be the first true test of whether Canadian snowbirds return.
What to watch in the summer report
- Whether visitation stayed positive in April–June. The comparison base is soft: the same quarter of 2025 saw visitation down 2.2%, spending down 4.1%, shopping spending down 15.2% and restaurant spending down 7.3%, with Fifth Avenue South merchants telling the council business had “fallen off a cliff.” Beating that base is expected; the size of the beat is the signal.
- June occupancy against 53.5% and ADR against $289.64, last year’s marks.
- Restaurant and retail spending, the two categories that broke down in 2025 while accommodations held.
- Bed-tax pace. FGCU’s seasonally adjusted real collections were $4.0 million in May, up 5.7% year over year; the county’s conservative FY2027 budget assumes $41.8 million against actual collections near $50 million.
Frequently Asked Questions
How many tourists visit Naples and Collier County? About 849,000 visitors in January–March 2026, the peak season, and roughly 667,000 in October–December 2025. Annual visitation runs in the low millions.
How much do tourists spend in Collier County? Direct visitor spending was $1.149 billion in the first quarter of 2026, up 8.5% from a year earlier.
What is the average hotel rate in Naples? $477.40 in the first quarter of 2026, up 9.2%, with March rates above $500. Off-season rates fall below $300.
Is Collier tourism recovering from Hurricane Ian? Yes. Every tracked metric rose in the January–March 2026 quarter, fiscal 2025 bed-tax collections were up 13%, and occupancy rose despite a large increase in room supply.
Why are fewer Canadians visiting Naples? The county cites currency exchange pressure, airfare costs and changing travel behavior. Canadian visitation fell 16%–24% in recent reporting periods, though the decline is narrowing.
What is the Paradise Coast Momentum Index? A Florida Authority Network composite averaging year-over-year change in visitation, direct spending, hotel ADR, hotel occupancy and RevPAR for Collier County each quarter. January–March 2026: +6.6.
Brian’s Take
Every destination claims a recovery; the honest test is whether it can raise price and fill more rooms at the same time, and Collier did both in season. The part I would not take for granted is the mix. Domestic Northeast money is carrying the numbers while Canada, historically the most loyal cohort, is still in retreat, and the strongest growth in April came from group business, not leisure. That is a healthier base than 2019’s, but it is a different one, and it is more sensitive to the marketing budget the council just voted to trim. If the summer report shows restaurants and shops recovering alongside hotels, the corner is truly turned. If accommodations keep winning while Fifth Avenue keeps losing, the county has a rate story, not a tourism story.
Sources and Methodology
- Downs & St. Germain Research, quarterly visitor profile and economic impact reports to the Collier County Tourist Development Council, February 10 and May 19, 2026
- Naples, Marco Island, Everglades Convention & Visitors Bureau (Jay Tusa, executive tourism director): fiscal 2025 review; FY2027 TDT projection; April 2026 event and STR summary
- STR hotel performance data as reported to the TDC
- Collier County Tax Collector tourist development tax collections; FGCU Lutgert College of Business RERI seasonally adjusted tourist tax dashboard (May 2026)
- Prior-year comparison data: Downs & St. Germain report for April–June 2025 (August 2025 TDC meeting)
- Paradise Coast Momentum Index methodology: simple average of year-over-year percentage change in visitation, direct visitor spending, hotel ADR and RevPAR, plus year-over-year change in occupancy in percentage points. Where a quarterly figure is unpublished, the nearest reported monthly value is substituted and flagged. Florida Authority Network proprietary composite.
NaplesBusinessNews.com is part of the Florida Authority Network, an independent publisher of Florida business and economic news.
About the Author