The Collier Carry Cost Index: What It Really Costs to Own a Home in Naples After the Closing
By Brian French | NaplesBusinessNews.com | September 3, 2026
Third installment in the Florida Authority Network’s Naples market-index series. Companion to the Collier Cash Market Index and the Naples Luxury Leverage Score. Updated with each insurance, tax and association-fee cycle.
Quick Answer
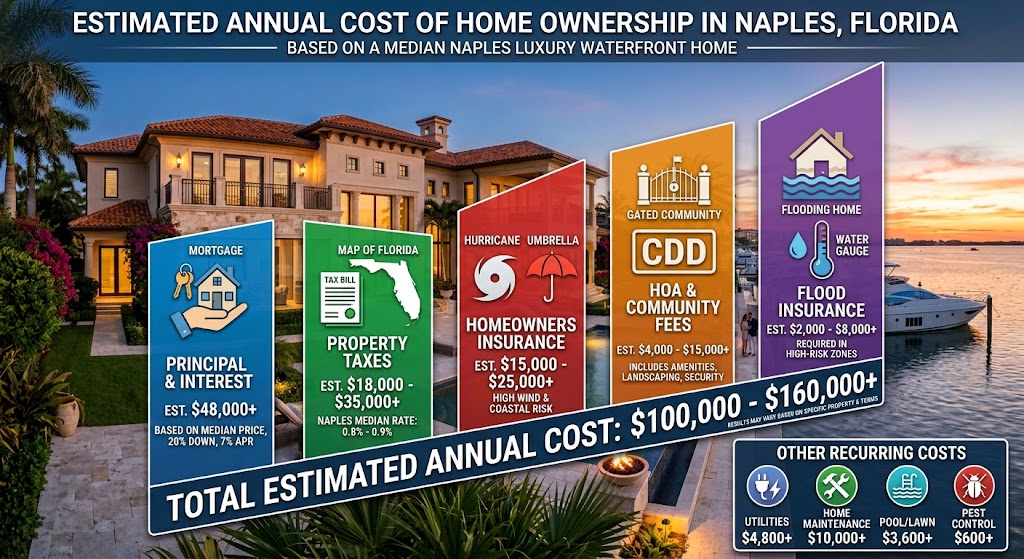
The purchase price is the headline in Naples; the carry cost is the deal-killer. Once property tax, windstorm and flood insurance, association dues and district assessments are stacked, a typical Collier County owner pays roughly 2% to 6% of the home’s value every year just to hold it, before a mortgage payment or a dollar of maintenance. The Florida Authority Network’s Collier Carry Cost Index models that stack for three representative Naples properties and finds a pattern most buyers miss: the burden is regressive. A $400,000 condo carries an estimated 3.5%–5.7% of its value annually; a $745,000 gated single-family home about 2.3%–4.0%; a $1.9 million coastal City of Naples home about 1.7%–2.5%. The cheaper the property, the larger the share of its value consumed by holding it.
Why Collier’s carry cost is different
Three structural facts set Naples apart from most U.S. markets, and even from most of Florida.
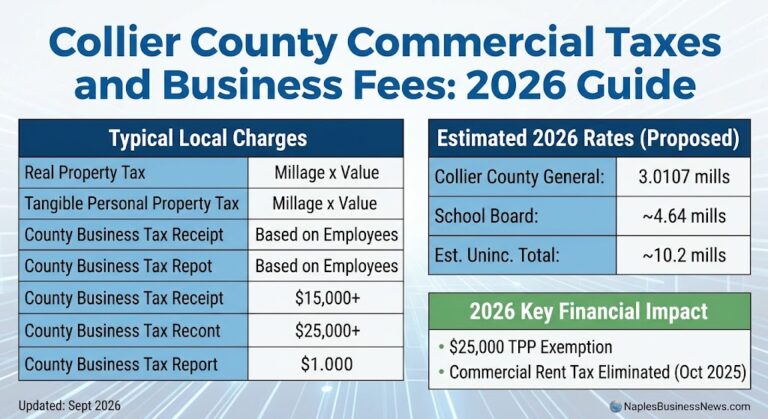
Taxes reset at purchase. Florida’s Save Our Homes cap limits assessment growth on a homesteaded property (2.7% for 2026), but the cap dies with the sale. A buyer pays year-one tax on the full purchase price, not the seller’s capped bill that appears in the listing. In Collier, total millage runs about 11.05 mills countywide (roughly 4.64 of that for schools), with the county’s own general fund set at 3.0107 mills and smaller levies for the unincorporated area (0.6844), Conservation Collier (0.2096) and water pollution control. The City of Naples adds its own low municipal rate. Non-homestead owners, which in a 53%-cash second-home market is a large share of buyers, get no exemption and no cap.
Insurance is a coastal, post-Ian market. Collier home insurance rose roughly 42% between 2022 and 2024. The market has since softened: Citizens Property Insurance cut rates an average 8.7% statewide at spring 2026 renewals, with a 3.4% multi-peril reduction filed for Collier, and private carriers have re-entered. But a standard single-family policy in Collier still runs about $4,000 to $6,800 a year, coastal waterfront homes can run two to three times that, and a separate 2%–5% hurricane deductible sits on top. Collier is notably a private-market county: only about 2,002 Citizens policies were in force in April 2026 out of roughly 229,000 statewide. That is good news for availability and a warning that most Collier owners are exposed to private-carrier repricing rather than state-set rates.
Flood is a second policy. Standard homeowners insurance excludes flood. Much of coastal Collier sits in FEMA special flood hazard zones where NFIP or private flood coverage runs from about $1,500 to more than $6,000 a year, and lenders require it on any financed home in those zones.
Associations carry the building. Florida ranks among the highest-HOA-fee states in the country, and post-Surfside structural inspection and reserve laws have pushed condo associations to fund reserves that were deferred for decades. In Collier that shows up as rising monthly dues, special assessments and, in the July 2026 NABOR data, a condo median down 4.8% to $400,000 while single-family rose 12.9%, as buyers underwrite the association before the unit. Newer master-planned communities add community development district (CDD) assessments of roughly $1,000 to $2,500 a year on the same November tax bill.
The Collier Carry Cost Index: three Naples archetypes
The index models annual holding cost for three representative purchases, using published 2026 tax, insurance and fee ranges. All figures are annual, exclude mortgage principal and interest, and assume a non-homestead (second-home) owner unless noted. Ranges reflect the spread between a well-mitigated, inland or newer property and an older, coastal or high-amenity one.
| Cost component | A: $400,000 condo (county condo median) | B: $745,000 gated single-family (county SF median) | C: $1.9M coastal City of Naples home (city median) |
|---|---|---|---|
| Property tax, year one (non-homestead) | ~$4,400 | ~$8,200 | ~$17,000–$19,000 (city millage differs) |
| Homeowners / walls-in insurance | $1,500–$2,500 (HO-6; building coverage in master policy) | $4,000–$6,800 | $10,000–$20,000+ (coastal wind pricing) |
| Flood insurance | $500–$1,000 (contents; building in master policy) | $1,500–$4,000 | $4,000–$8,000+ (AE/VE zones) |
| Association dues | $7,200–$14,400 ($600–$1,200/mo; master insurance and reserves embedded) | $3,600–$8,400 ($300–$700/mo) | $0–$2,000 (many Old Naples / Port Royal homes have no HOA) |
| CDD / special-district assessment | $0–$1,000 | $0–$2,500 | $0 |
| Estimated annual carry | $13,600–$23,300 | $17,300–$29,900 | $31,000–$49,000 |
| Carry as % of value (Collier Carry Ratio) | 3.4%–5.8% | 2.3%–4.0% | 1.6%–2.6% |
| Monthly equivalent | $1,130–$1,940 | $1,440–$2,490 | $2,580–$4,080 |
Homestead adjustment: an owner-occupant with the standard $50,000 exemption would reduce year-one tax by roughly $550 on each archetype, and gain the Save Our Homes cap on future increases. Modeled ranges use published 2026 Collier rates; individual quotes vary with roof age, elevation, wind mitigation and association reserves. Methodology at end.
What the index reveals
Carry is regressive. The condo buyer at $400,000 spends up to 5.8% of the property’s value each year to hold it; the coastal estate owner spends under 3%. The reason is arithmetic: association dues and master-policy insurance are priced per unit and per building, not per dollar of value, so they land hardest on the least expensive product. This is the hidden force behind the condo softness in the July data. At 5% carry, a $400,000 condo costs $20,000 a year before financing; a buyer comparing that to a $600,000 single-family home at 3% carry ($18,000) sees the condo is not the cheaper home to own.
Insurance, not tax, is the swing variable. Property tax is predictable and public. Insurance is where two identical homes diverge by $10,000 a year based on a roof date, an elevation certificate or a flood-zone letter. For anything financed, lenders now collect actual quotes, not estimates, during underwriting; a bad quote can move a debt-to-income ratio past the line. For cash buyers, who dominate Collier, the quote is the difference between a second home and a money pit.
The jumbo line compounds it. Collier’s 2026 conforming loan limit is $832,750. Most single-family purchases above the county median finance in jumbo territory, which means 20%–30% down, 720-plus credit and reserve requirements, and lenders apply the full carry stack to qualification. The carry cost is not just a budget line; it determines who can buy.
November could move the tax line. Two ballot items bear on carry. A homestead-exemption expansion passed by the Legislature on June 2, 2026 goes to voters in November and needs 60% approval; local estimates put Collier’s potential revenue impact near $63 million, which would pressure millage debates the following year. Separately, Collier’s one-cent tourist tax referendum affects short-term rental owners’ pricing, not carry directly. Owners who believe their assessment is too high have until September 15 to petition the Value Adjustment Board.
Community snapshot: where each carry driver bites hardest
| Area | Dominant carry driver | Why |
|---|---|---|
| Marco Island, Vanderbilt Beach, Park Shore, Pelican Bay | Wind and flood insurance | Tier 1 wind zone, coastal AE/VE flood zones, older mid-rise stock under new reserve rules |
| Old Naples, Port Royal, Aqualane Shores | Property tax and coastal insurance | Highest values reset at purchase; often no HOA to spread cost |
| North Naples golf communities (Mediterra, Talis Park, Grey Oaks) | Association and club dues | High-amenity budgets; mandatory or bundled club membership on top of HOA |
| Golden Gate Estates | Insurance on older homes, well and septic | No HOA; larger lots; roof age drives premiums |
| Ave Maria, Brightshore, eastern Collier new build | CDD assessments | Infrastructure bonds repaid through 20–30-year district assessments |
Frequently Asked Questions
How much does it cost to own a home in Naples each year beyond the mortgage? Roughly 2% to 6% of the home’s value, depending on property type and location. A $400,000 condo runs about $13,600–$23,300 a year in tax, insurance and dues; a $745,000 single-family home about $17,300–$29,900; a $1.9 million coastal home about $31,000–$49,000.
Why are Naples condo fees so high? Post-Surfside law requires structural inspections and funded reserves, and the master insurance policy on a coastal building is expensive; both are passed through in dues. Buildings that deferred reserves for years are now catching up through higher monthly fees and special assessments.
What is the property tax rate in Collier County? Total millage is about 11.05 mills countywide (roughly 1.1% of taxable value), including school levies. The county general fund is 3.0107 mills. Taxable value resets to purchase price when a home sells.
How much is homeowners insurance in Naples? A standard single-family policy in Collier averages about $4,000–$6,800 a year in 2026; coastal waterfront homes can run $10,000–$20,000 or more. Flood coverage is separate, typically $1,500–$6,000-plus in flood zones.
Are insurance rates going down in Collier County? Modestly. Citizens cut rates 8.7% statewide at spring 2026 renewals with a 3.4% reduction filed for Collier, and private carriers are competing again. Most Collier owners are on private policies, so relief depends on the carrier and the roof.
What is the Collier Carry Cost Index? A Florida Authority Network model that stacks property tax, homeowners and flood insurance, association dues and CDD assessments for three representative Naples purchases and expresses the total as a share of property value (the Collier Carry Ratio). It is updated as tax rolls, rate filings and fee data change.
Brian’s Take
Every market has a price and a cost, and Naples is a place where the two have drifted apart. The condo math is the clearest example: a unit that looks like the affordable way into Naples can cost more to hold, as a share of its value, than a house twice its price. That is not a reason to avoid condos; it is a reason to read the association’s reserve study before the inspection report. For anyone shopping this fall, get the insurance quote before the offer, price the tax at your purchase price rather than the seller’s bill, and treat the monthly carry figure as the real price of the home. The buyers who do that are the ones setting prices in Collier right now, and the sellers who understand it are the ones closing.
Sources and Methodology
- Collier County Board of County Commissioners and Clerk of the Circuit Court & Comptroller: FY2026 maximum millage rates (general fund 3.0107, unincorporated 0.6844, Conservation Collier 0.2096, water pollution control 0.0246); Florida TaxWatch 2025 county total millage estimate (~11.05 mills)
- Florida Department of Revenue: Save Our Homes 2026 assessment cap (2.7%); homestead exemption rules; Value Adjustment Board petition deadline
- Citizens Property Insurance Corporation: policies in force by county (April 2026); 2026 rate filings including the statewide average reduction and Collier multi-peril adjustment
- Florida Office of Insurance Regulation: 2026 Property Insurance Stability Report; carrier rate filings
- Published 2026 Collier premium ranges compiled from independent-agency and carrier-filing summaries (single-family HO-3, HO-6 condo, NFIP and private flood)
- Naples Area Board of REALTORS® July 2026 report (condo and single-family medians); Florida Realtors SunStats July 2026 (City of Naples median, cash share)
- Federal Housing Finance Agency: 2026 conforming loan limit, Collier County ($832,750)
- Florida Legislature: homestead-exemption expansion passed June 2, 2026, November 2026 ballot
- Collier Carry Cost Index methodology: annual property tax modeled at purchase price × county total millage (city archetype uses a lower blended rate reflecting City of Naples municipal millage), non-homestead; insurance and flood ranges from published 2026 Collier averages by property type and coastal exposure; association dues from representative listing data by community type; CDD ranges from published Collier district assessment data. Ranges, not point estimates, are reported by design. Florida Authority Network proprietary composite.
NaplesBusinessNews.com is part of the Florida Authority Network, an independent publisher of Florida business and economic news. This article is informational and is not tax, insurance or investment advice.
About the Author