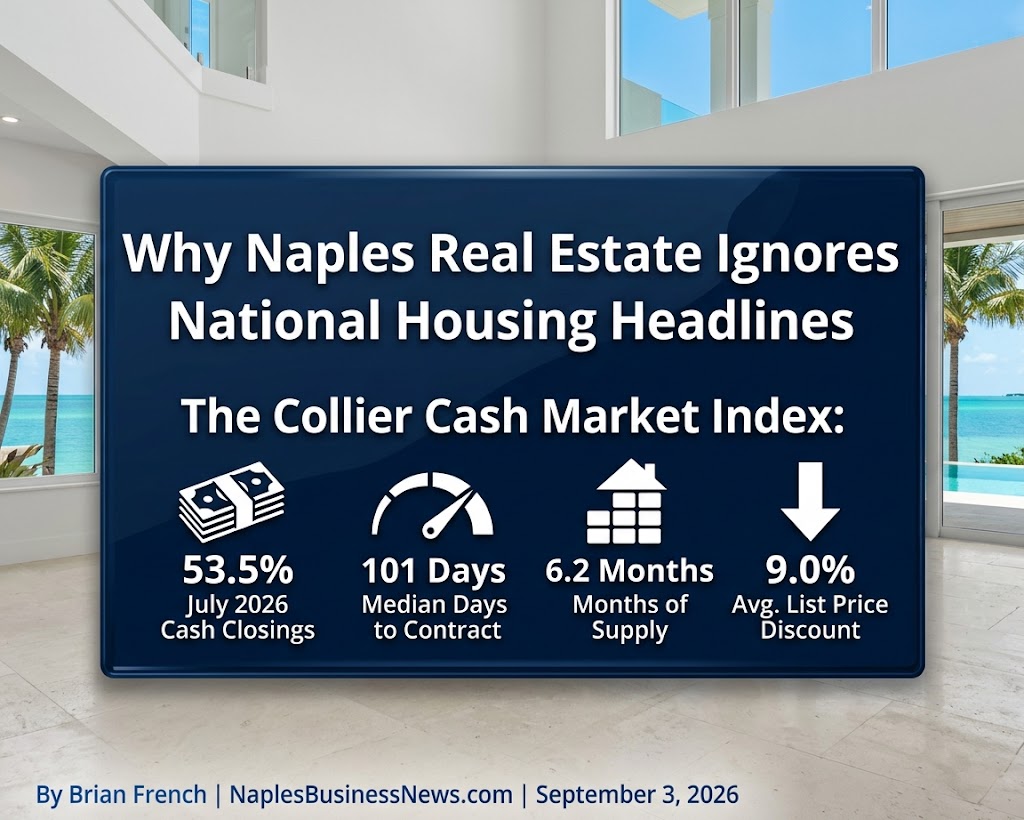
The Collier Cash Market Index:
By Brian French | NaplesBusinessNews.com | September 3, 2026
Part of the Florida Authority Network’s proprietary market-index series. Updated monthly with each Florida Realtors SunStats and NABOR release. Next update: September 18, 2026 (August data).
Quick Answer
More than half of all home closings in Collier County are paid in cash — 53.5% in July 2026, against 33.4% for Florida as a whole. That single fact explains why Naples moves slower, prices higher and discounts deeper than the rest of the state, and why mortgage-rate headlines are a poor guide to what happens here. The Florida Authority Network’s new Collier Cash Market Index (CCMI) scores Collier’s divergence from the statewide market at 162 for July 2026, where Florida equals 100. In plain terms: on the four measures that define how a housing market actually transacts, Collier County behaves about 1.6 times differently from the Florida average.
What the Collier Cash Market Index measures
National housing coverage runs on one variable: the 30-year mortgage rate. That framework assumes a buyer who finances. In Collier County that buyer is the minority. To track the market on its own terms, NaplesBusinessNews.com built a composite from four transaction-mechanics metrics published monthly by Florida Realtors SunStats, each expressed as a ratio of Collier County to statewide Florida:
| Component | Collier County (July 2026) | Florida (July 2026) | Collier ÷ Florida |
|---|---|---|---|
| Cash share of closings | 53.5% | 33.4% | 1.60 |
| Median days to contract | 101 | 54 | 1.87 |
| Months of supply | 6.2 | 5.4 | 1.15 |
| Discount from original list price* | 9.0% | 4.8% | 1.88 |
| CCMI (average × 100) | 162 |
*Calculated as 100% minus percent of original list price received (91.0% Collier, 95.2% Florida).
A reading of 100 would mean Collier transacts exactly like the rest of Florida. July 2026’s 162 is the index’s baseline month. From here the number that matters is direction: a rising CCMI means the Naples market is decoupling further from state and national conditions; a falling CCMI means it is converging. Source data: Florida Realtors SunStats, Collier County (including Marco Island), July 2026.
Why cash changes everything
Cash is not a detail of this market; it is the operating system.
Rates matter less. Freddie Mac’s 30-year average drifted back up to roughly 6.65% in late August after touching the low-6s in early July. In a market where a third of buyers finance, that swing pulls demand. In Collier, where half don’t, it barely registers. The Naples Area Board of Realtors’ July report showed closed sales up 14.5% year over year even as rates rose, with active inventory down 21% to 4,415 listings and months of supply falling from 8.7 a year ago to 5.8.
Deals take twice as long. A cash buyer of a $600,000 second home is not racing a rate lock. Collier’s median 101 days to contract, against 54 statewide, reflects a deliberate, discretionary buyer pool that shops for months and walks away easily.
Sellers pay for optimism. Collier sellers ultimately receive about 91% of their original asking price versus 95% statewide. That nine-point haircut is the cost of pricing a home to 2022 and letting the market correct it. NABOR’s figure for percent of last list price is higher, 94.4%, which shows how much of the gap is closed through reductions before a contract is signed.
Distress is nearly absent. Cash owners cannot be foreclosed on for a mortgage they don’t have. Distressed transactions (foreclosures and short sales) were 0.35% of Collier closings in 2025, 32 sales out of 9,219. In 2010 they were 40.1%. Whatever a future downturn in Naples looks like, it will not be triggered by the forced-seller mechanism that drove the last one.
Inventory in Collier is a demand story, not a supply story
One of the most persistent errors in Naples market commentary is reading a rise in listings as a flood of sellers. The eighteen-year SunStats record shows new listings in Collier County have stayed inside a narrow band, roughly 13,000 to 16,000 a year, through the 2009 crash, the 2021 frenzy and everything since. Supply does not surge here. What moves is absorption. In 2021 the county closed 1.09 sales for every new listing; in 2024 and 2025 it closed 0.59. When months of supply climbs, it is because buyers stepped back, not because owners rushed for the exits.
That is also why July’s tightening is meaningful. Supply dropped from 9.0 months to 6.2 in a year, landing inside the 5.6-to-8.6 range that characterized the “normal” 2013–2019 market. Collier reached balance from above, by demand recovering, not from below.
Sub-market snapshot: where the cash concentrates
Countywide figures hide the spread. The City of Naples is the purest cash market in Southwest Florida; the Lee County suburbs to the north are the tightest.
| Sub-market | Median sale price | Months of supply | Days to contract | Cash share |
|---|---|---|---|---|
| City of Naples | $1,892,500 | 8.4 | 126 | 72.7% |
| Marco Island | $798,000 | 6.0 | 118 | 47.4% |
| Bonita Springs (Lee) | $490,000 | 4.7 | 93 | 55.8% |
| Estero (Lee) | $415,000 | 4.0 | 96 | 58.6% |
| Collier County overall | $599,000 | 6.2 | 101 | 53.5% |
Source: Florida Realtors SunStats, July 2026. Single-month figures for small geographies move with sales mix; read the trend, not the decimal.
Note that the City of Naples’ 8.4 months of supply is not a warning signal. Nearly three-quarters cash, a $1.9 million median and four-month contract timelines describe a high-end market where nobody is in a hurry, which is exactly what the CCMI is built to distinguish from genuine weakness.
The two-market problem: houses vs. condos
The cash thesis also explains the sharpest split inside Collier right now. NABOR’s July data put the single-family median at $745,000, up 12.9% year over year, while the condo median slipped 4.8% to $400,000, with condos taking 120 days to sell against 99 for houses. Post-Surfside structural inspection and reserve requirements are pushing older-building owners to list while buyers underwrite the association before the unit. Cash buyers, who have the most options, are choosing houses.
What the index will track from here
Each month NaplesBusinessNews.com will publish the updated CCMI alongside the four component ratios. Three things to watch:
- The cash share. If it drops below 50%, Collier is beginning to behave like a financed market and rate sensitivity rises.
- Days to contract relative to Florida. A narrowing gap signals urgency returning to the buyer pool.
- The list-price discount. A shrinking Collier discount means sellers have finally repriced to the current comp set.
Frequently Asked Questions
What is the Collier Cash Market Index? A Florida Authority Network composite that measures how differently Collier County’s housing market transacts compared with Florida statewide, using cash share, days to contract, months of supply and discount from original list price. Florida = 100. July 2026 baseline = 162.
What percentage of Naples home sales are cash? 53.5% of Collier County closings in July 2026 were cash, per Florida Realtors SunStats. In the City of Naples the share was 72.7%.
Do mortgage rates affect Naples home prices? Far less than elsewhere. With a majority of buyers paying cash, Collier sales rose 14.5% in July 2026 even as rates climbed. Rates matter most in the sub-$600,000 condo and Estates segments where financing is more common.
Is Naples a buyer’s or seller’s market in 2026? Balanced, tilting buyer’s, but tightening: 5.8 months of supply (NABOR, excluding Marco Island) versus 8.7 a year earlier. Single-family is tighter than condos.
Are foreclosures rising in Collier County? No. Distressed sales were 0.35% of closings in 2025 and have been under 1% every year since 2020.
Why do two different Naples median prices appear in the news? NABOR reports Collier County excluding Marco Island ($590,000 in July 2026). SunStats includes Marco Island ($599,000). Both are correct for their geography.
Brian’s Take
I managed money for a living before I published news, and the first thing you learn is that a market’s structure predicts its behavior better than any headline. Naples is structurally a cash market, which means it is really a wealth market: it tracks equity portfolios, northern home sales and estate transfers, not Freddie Mac. That’s why national “housing crash” forecasts have been wrong about Collier for fifteen years and will keep being wrong. The risks here are different: a bad storm season, insurance and HOA carry costs that start to erode the second-home math, and a condo segment being repriced by inspection law rather than demand. Watch the cash share. As long as it stays above half, the buyer who sets prices in Naples is not the one the Fed is talking to.
Sources and Methodology
- Florida Realtors® SunStats, Collier County and statewide Florida, July 2026 (cash share, days to contract, months of supply, percent of original list price, sub-market data, historical distressed-sale and new-listing series 2008–2025)
- Naples Area Board of REALTORS® (NABOR®), July 2026 Market Report, released August 21, 2026 (median price, closed sales, inventory, single-family vs. condo detail; Collier County excluding Marco Island)
- Freddie Mac Primary Mortgage Market Survey, August 2026
- Collier Cash Market Index methodology: equal-weighted average of four Collier-to-Florida ratios, multiplied by 100; baseline July 2026. Florida Authority Network proprietary composite. Full component data available on request.
NaplesBusinessNews.com is part of the Florida Authority Network, an independent publisher of Florida business and economic news.
About the Author