The People Moving to Naples Earn Three Times What the County Does, and They Are the Whole Growth Story
By Brian French | NaplesBusinessNews.com | September 10, 2026
Tenth and concluding installment in the Florida Authority Network’s Naples market-index series. Updated annually with IRS county-to-county migration data and Census population estimates, and quarterly with labor-market data.
Quick Answer
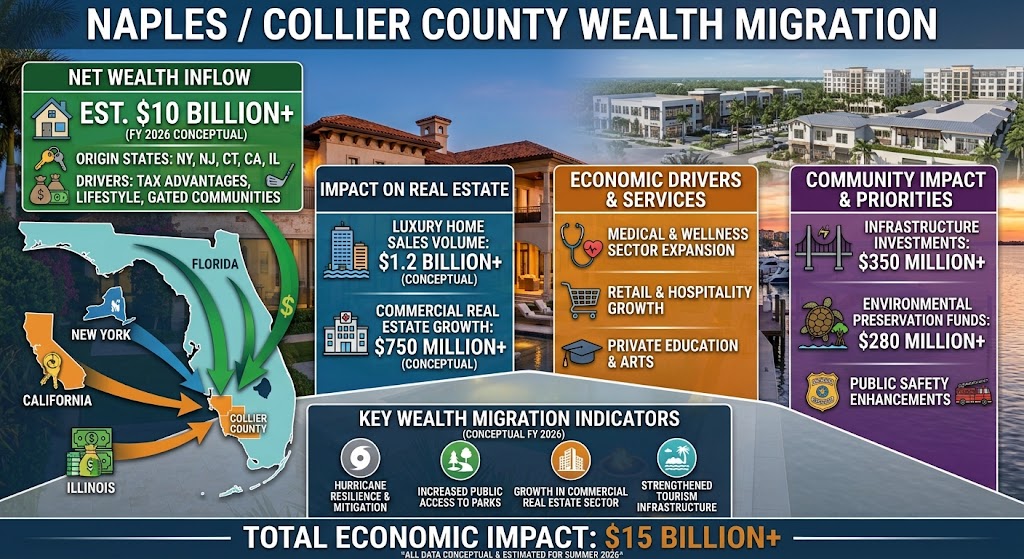
Collier County grew to about 417,000 residents in 2025, and every one of the new ones arrived by moving truck. Deaths exceeded births by about 1,100 in the latest Census year, so the county’s roughly 6,200-person annual gain (1.5%) is entirely migration, continuing a decade in which the population rose nearly 20%. Who is coming matters more than how many: IRS county-to-county data show arriving households reporting average income near $283,000, led by Illinois, New York, Massachusetts and New Jersey. The Florida Authority Network’s Collier Wealth Migration Index compares that figure to the county’s own median household income and finds newcomers earn roughly 3.3 times the resident median. That single ratio explains the 53.5% cash share of home sales, the $1.9 million City of Naples median, the luxury-tier pricing, the HOA fights and the out-of-town capital buying commercial property. Naples is not growing; it is being bought.
The migration ledger
| Measure | Value | Source |
|---|---|---|
| Population, 2025 | ~417,100 | Census Bureau estimates |
| Annual change, 2023–2024 | +6,200 (+1.5%) | Census / USAFacts |
| Natural change (births − deaths), 2023–2024 | −1,100 | Census |
| Growth from migration | >100% | FAN calculation |
| Ten-year growth, 2014–2024 | +19.8% | Census |
| Largest single-year gain | +13,200 (2021–2022) | Census |
| Median age | 53.3 | ACS 2024 |
| Unemployment rate, 2026 | 4.5% | BLS/LAUS |
| Top inbound states | IL, NY, MA, NJ | IRS SOI county migration, 2022–2023 |
| Average income of arriving households | ~$283,000 | IRS SOI, 2022–2023 |
| County median household income | ~$85,000 (ACS) | Census ACS |
| Collier Wealth Migration Index | ~3.3× | FAN calculation |
The Index is arriving-household average AGI divided by resident median household income. Averages and medians are not identical measures; the Index is a scale indicator, not a precise ratio, and will be refined as the IRS releases 2023–2024 flows.
This is not new. Forbes’ analysis of IRS data for 2008 already ranked Collier first in the nation for where the wealthy were relocating, with arrivals reporting the equivalent of about $305,000 per family of four while departing residents averaged a fraction of that. What has changed is the scale, the source geography (the Northeast has overtaken the Midwest) and the fact that natural population change has turned negative, leaving migration as the only engine.
How the Index shows up everywhere else in the series
Each of the nine prior installments in this series is, at bottom, a symptom of the number above.
| Earlier index | Reading | The migration explanation |
|---|---|---|
| Collier Cash Market Index | 162 (Florida = 100); 53.5% cash | Households earning $283,000 who sold a Northeast home do not need a mortgage |
| Naples Luxury Leverage Score | 209 sales above $1M in July; $41M top sale | The top of the inbound distribution buys the coast |
| Collier Carry Cost Index | 2%–6% of value per year | Affordable to the arriving cohort; punishing for the resident one |
| Tourism Scorecard | Northeast visitors +14.6% | Visitors from the same states become buyers |
| Eastern Collier Build-Out Tracker | ~25,850 entitled homes | Where the workforce that serves the newcomers can afford to live |
| Commercial Deal Ledger | 66% out-of-county capital | Institutional money following the rent roll the migrants created |
| Budget & Millage | $3.17B; non-homestead base | Second-home owners pay full freight, which is why the November homestead amendment shifts burden to them |
| STR Yield Index | Gross 3%–6% | Seasonal owners covering carry on homes they will eventually occupy |
Why they come, in the data
Tax. Florida has no state income tax; Illinois, New York, Massachusetts and New Jersey all levy one, and three of the four have raised top rates or surtaxes on high earners since 2020. For a household at $283,000, the arithmetic is five figures a year before estate-tax considerations. The City of Naples adds one of the lowest municipal millage rates in the state, and Collier’s effective property tax burden, at roughly 0.7%–1.0% of value, undercuts most Northeast counties even at Naples prices.
Credit and services. Collier holds a AAA rating from Fitch, its public school district earned an “A” and ranked fifth of 67 Florida districts for 2024–25, and its hospital system, medical-device employer base (Arthrex is headquartered in Naples) and professional-services sector are sized for a wealthy retiree and pre-retiree population. Median age 53.3 is the profile of a county that imports people at the peak of their earning and net-worth curve.
The pipeline is the tourist. The county’s tourism research shows the fastest-growing visitor segment is the Northeast, up 14.6% in the 2026 peak season. Collier’s marketing dollars are, functionally, a relocation-recruiting budget: the January visitor from Westchester is the March buyer in Pelican Bay.
And the cost is what it is. Median household income of roughly $85,000 against a $599,000 median home and a $400,000 median condo is a 7-to-1 price-to-income ratio for the people who already live here. That is the tension the eastern villages’ 1,200-plus affordable units, the county’s workforce-housing debates and the school district’s teacher-recruiting problems are all trying to resolve.
What the Index will track
- IRS 2023–2024 county flows when released: whether average inbound AGI and the Northeast share keep rising.
- Net domestic migration in the Census 2026 vintage estimates.
- Employer relocations and expansions announced through the Greater Naples Chamber and Collier’s economic development office, logged by headcount and sector.
- The homestead amendment’s effect: if the $250,000 exemption passes in November, whether it changes the homestead-versus-second-home mix of new buyers.
- Inbound income versus resident wages annually, the Index itself.
Frequently Asked Questions
Is Naples, Florida growing? Yes. Collier County reached about 417,000 residents in 2025, adding roughly 6,200 people a year (1.5%). All of that growth comes from people moving in; deaths exceed births.
Where are people moving to Naples from? Per IRS data, the largest inbound flows are from Illinois, New York, Massachusetts and New Jersey, plus other Florida counties.
How much do people moving to Naples earn? Arriving households reported average income of roughly $283,000 in the most recent IRS county-to-county data (2022–2023), about 3.3 times Collier’s median household income.
Why do wealthy people move to Naples? No state income tax, low municipal millage in the City of Naples, a AAA-rated county, top-five-ranked schools, a mature medical and professional-services base, and a warm-season visitor relationship that often precedes the purchase.
What is the median age in Collier County? About 53.3, among the oldest of Florida’s large counties, reflecting a retiree and pre-retiree inbound profile.
What is the Collier Wealth Migration Index? A Florida Authority Network measure dividing the average income of households moving into Collier County by the county’s resident median household income. Current reading: about 3.3×.
Brian’s Take
When I managed money, the first question about any market was who the marginal buyer is. In Collier the marginal buyer is a household from the Northeast earning $283,000 with a house to sell and a state income tax to escape, and that buyer sets the price of everything: the condo, the insurance, the apartment rent, the commercial cap rate and, come November, the county’s tax base. That is a durable engine, more durable than tourism or rates, and it is why the crash calls have been wrong for fifteen years. It is also a fragile social contract. A county where newcomers earn three times what residents do, where the population only grows by import and where the teachers, nurses and contractors serving the newcomers face a seven-times price-to-income ratio, is running on the eastern villages getting built and the roads getting funded. The Wealth Migration Index is the number I would watch above all the others in this series. As long as it stays above three, Naples is fine. The question is whether everyone who makes Naples work can still afford to live in it.
Sources and Methodology
- U.S. Census Bureau: Vintage 2025 population estimates; components of change (births, deaths, migration); American Community Survey 2024 (median age, median household income)
- Internal Revenue Service, Statistics of Income: county-to-county migration data, Filing Years 2022–2023 (inflow returns, exemptions, adjusted gross income by origin county and state)
- Bureau of Labor Statistics / Florida Commerce LAUS: Collier County unemployment, 2026
- Fitch Ratings: Collier County AAA affirmation (April 2025); Florida Department of Education district grades 2024–25
- Naples, Marco Island, Everglades CVB and Downs & St. Germain: visitor origin data, Q1 2026
- Florida Realtors SunStats, July 2026; NABOR July 2026 report
- Forbes / IRS analysis of 2008 county migration (historical context)
- Prior installments of the NaplesBusinessNews.com index series (September 2026)
- Collier Wealth Migration Index methodology: average AGI per inbound return (IRS SOI) ÷ resident median household income (ACS). Reported as an approximate multiple; revised on each IRS and ACS release. Florida Authority Network proprietary composite.
NaplesBusinessNews.com is part of the Florida Authority Network, an independent publisher of Florida business and eco
About the Author