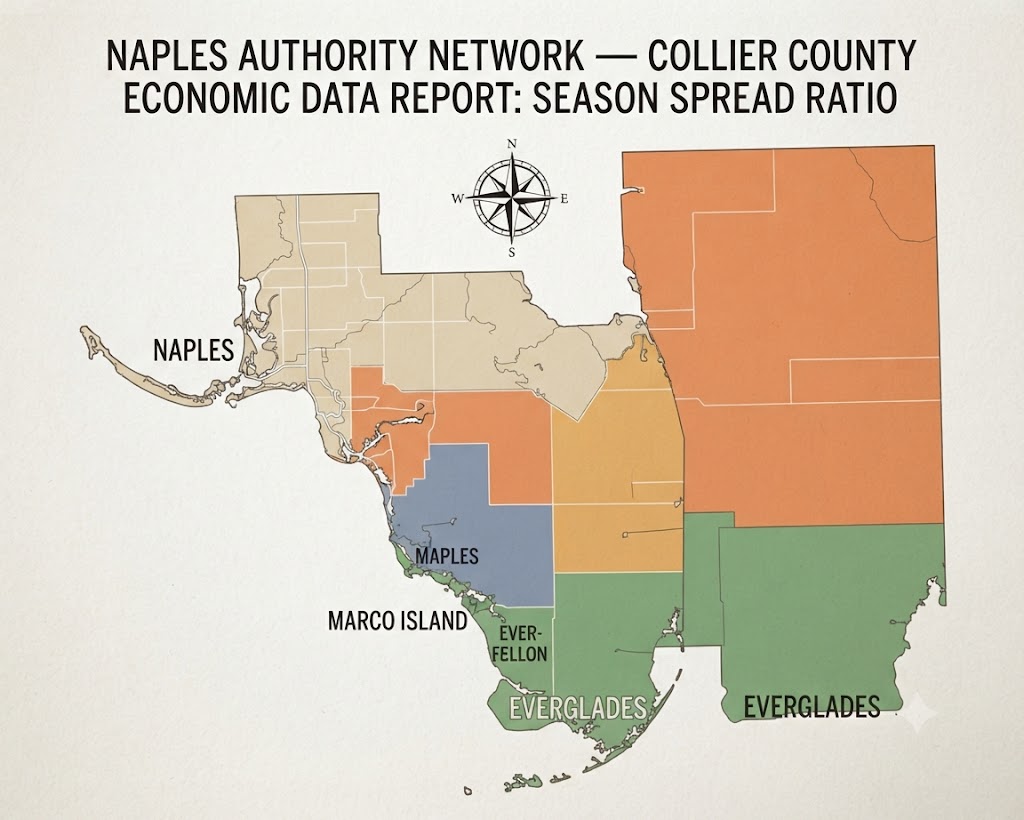
The inaugural Collier County economic data report from Naples Business News — and the first to publish every indicator the way this county’s economy actually behaves: as two numbers, not one.
By Brian French | Naples Business News | Florida Authority Network
Published: July 26, 2026 · Last reviewed: July 26, 2026 · Next release: Winter 2027
Answer in Brief
Collier County does not have an economy. It has two — an in-season economy running November through April and an off-season economy running May through October — and nearly every published statistic about Naples blends them into a single annual average that describes neither. This report presents Collier County’s key indicators as paired figures, alongside the gap between them, which we call the Season Spread. It is the first Collier County data report built this way.
Key Findings
- Tourism is running ahead of last year. Direct visitor spending reached roughly $1.149 billion in Q1 2026, up 8.5% year over year, on visitation of approximately 849,000, up 5.5%.
- The mix shifted. Domestic visitation rose 7.1% while international visitation fell 6.2% — a divergence with direct implications for retail, hospitality, and luxury real estate.
- Bed tax collections are tracking above budget. March 2026 alone exceeded $7.93 million, with fiscal year-to-date collections above $25.9 million at that point. Projected FY2027 revenue is $41,811,300.
- A 1¢ tourist tax increase is on the November 3, 2026 ballot, projected to raise nearly $10 million annually beginning January 2027.
- Labor market: the Naples–Immokalee–Marco Island MSA recorded 4.6% unemployment in December 2025 (not seasonally adjusted), against annual averages of 3.4% in 2024 and 3.0% in 2023.
- The methodological finding matters most. Month-over-month comparisons in Collier County are close to meaningless. Same-month year-over-year is the only honest read.
Why This Report Exists
Here is a statistic, and it is a real one: the Naples–Immokalee–Marco Island metropolitan statistical area — which is coextensive with Collier County — posted an annual average unemployment rate of 3.4% in 2024.
Now here is what that number does not tell you. It does not tell you what unemployment was in February, when the county’s population had swelled, every restaurant on Fifth Avenue South was staffed to capacity, and hospitality employers were competing for workers. It does not tell you what it was in August, when a substantial share of that same seasonal employment had evaporated. It reports the average of two conditions and describes neither of them.
This is not a small technical quibble. It is the central problem with economic reporting in Collier County, and it repeats across every indicator we track: employment, retail activity, permits, transactions, sales tax, hotel occupancy, restaurant revenue, construction starts.
Collier County’s population, spending, employment, and decision-maker presence swing between the winter and summer halves of the year to a degree few American counties experience. A single annual figure averages across that swing. A month-over-month comparison is worse — it measures the calendar, not the economy, and it produces headlines about “declines” that are nothing more than the season ending on schedule.
So this report does something different. Every indicator here is published as a pair: the in-season figure, the off-season figure, and the gap between them.
Brian’s Take
When I was an equity analyst, the fastest way to embarrass yourself in front of a portfolio committee was to present a sequential comparison on a seasonal business.
You would put up a slide showing a retailer’s fourth quarter against its third quarter, note the enormous increase, and someone at the far end of the table would say, quietly, “That’s Christmas.” And they would be right, and you would have wasted everyone’s afternoon. Seasonal businesses are compared year over year, same period, always. Everyone in finance learns this in their first six months, and nobody ever unlearns it.
Collier County is a seasonal business. The entire county. And it is routinely reported on sequentially — this month against last month, this quarter against last quarter — producing a steady stream of local coverage announcing that things went up in January and down in June, which is roughly as informative as announcing that it got dark in the evening.
I do not think this is anyone’s fault, particularly. National data conventions were not built for a county that empties out for half the year. But it means that a business owner in Naples trying to read their own market is working from instruments that were calibrated somewhere else.
So we built different instruments. That is the entire purpose of this report, and it is why we will publish it twice a year rather than once — once for each economy.
— Brian French
The Season Spread: Definition and Method
Definition: The Season Spread is the difference between an economic indicator’s average value across Collier County’s in-season months (November 1 – April 30) and its average value across the off-season months (May 1 – October 31), expressed either in the indicator’s native units or as a ratio.
Reporting conventions used throughout this report:
- Same-month, year-over-year only. No month-over-month or quarter-over-quarter comparisons appear in this report except where explicitly labeled as such.
- Paired publication. Where a full twelve months of data exist, we publish the in-season figure, the off-season figure, and the spread.
- Direction is derived, never assumed. We do not assume which half of the year an indicator peaks in. Several Collier County series behave counterintuitively, and we report what the data shows.
- Not seasonally adjusted, where available. Standard seasonal adjustment models are calibrated to national patterns and can distort a market this seasonally extreme. We prefer raw series and disclose when a figure is adjusted.
- Every figure carries its source and release date. No number appears in this report without both.
1. Tourism and Visitor Spending
The most current and best-documented indicator set in the county, and the one where Collier’s reporting infrastructure genuinely leads the region.
Q1 2026 (in-season quarter)
| Indicator | Q1 2026 | Change YoY | Source |
|---|---|---|---|
| Direct visitor spending | $1.149 billion | +8.5% | CVB via TDC / Gulfshore Business |
| Total visitation | ~849,000 | +5.5% | CVB via TDC / Gulfshore Business |
| Domestic visitation | — | +7.1% | CVB via TDC / Gulfshore Business |
| International visitation | — | −6.2% | CVB via TDC / Gulfshore Business |
| Spend per visitor (derived) | ~$1,353 | +2.8% (derived) | Naples Business News calculation |
The finding under the headline. Spending grew faster than visitation — 8.5% against 5.5% — which means the average visitor spent more, not merely that more visitors came. Dividing the two yields roughly $1,353 in direct spending per visitor for the quarter, up approximately 2.8% year over year. For a Collier County business owner, that ratio is more actionable than either headline number: it says the marginal visitor arriving in Naples is not a budget visitor.
The divergence worth watching. Domestic up 7.1%, international down 6.2%. International visitors typically stay longer and spend more per trip in destination markets. A sustained decline in that segment, masked by domestic strength in the aggregate, would show up first in high-end retail, marine services, and luxury rentals — before it appears in any countywide statistic.
Tourist Development Tax collections
Collier County levies a 5% tourist development tax on accommodations rented for six months or less — hotels, condominium rentals, and short-term rental platforms. Because it is remitted monthly and reported publicly, it is the most timely economic indicator available for this county.
| Measure | Value | Source |
|---|---|---|
| March 2026 collections | > $7.93 million | CVB report to TDC |
| FY2026 collections through March | > $25.9 million | CVB report to TDC |
| April 2026, seasonally adj. real | $4.0 million (+6.7% YoY) | FGCU RERI dashboard |
| FY2027 projected revenue | $41,811,300 (+5% vs FY2026 budget) | CVB / TDC |
| Proposed 1¢ increase (Nov. 3, 2026 ballot) | ~$10 million annually, effective Jan. 2027 | Collier County / local reporting |
| PENDING Summer 2026 monthly collections (May, June)SOURCE: Collier County Tax Collector monthly TDT reports and CVB director’s report to the Tourist Development Council. Pull from TDC agenda packets at colliercountyfl.gov. TDC meets monthly; May and June figures typically reported in July and August packets. | PENDING | Tax Collector / TDC |
Season Spread — Tourist Development Tax: PENDINGCALCULATE: average monthly TDT collections Nov 2025–Apr 2026 vs. May 2026–Oct 2026, expressed as a ratio. This is the single most illustrative Season Spread figure in the report and should lead the Winter 2027 edition once the full off-season is complete. Requires the full twelve-month series from the Tax Collector.
2. Employment and Labor Force
The Naples–Immokalee–Marco Island MSA is coextensive with Collier County, which makes MSA-level BLS data directly usable at the county level — an advantage most Florida counties do not have.
Unemployment rate, Naples–Immokalee–Marco Island MSA (not seasonally adjusted)
| Period | Rate | Season |
|---|---|---|
| July 2025 | 4.3% | Off-season |
| August 2025 | 4.8% | Off-season |
| September 2025 | 4.7% | Off-season |
| November 2025 | 5.2% | In-season |
| December 2025 | 4.6% | In-season |
| PENDING Jan–Jun 2026 monthlySOURCE: BLS Local Area Unemployment Statistics, series NAPL912URN, via FRED (fred.stlouisfed.org/series/NAPL912URN) or FloridaCommerce Labor Market Statistics. Released monthly with roughly a one-month lag; June 2026 data should be available by late July 2026. | PENDING | — |
Annual averages (not seasonally adjusted): 3.4% (2024) · 3.0% (2023) · 3.1% (2022) · 4.0% (2021) · 7.7% (2020). Source: U.S. Bureau of Labor Statistics.
A methodological caution we are obligated to state. The monthly series above does not move in the direction casual intuition predicts. November 2025 registered higher than July 2025, despite November being an in-season month. We are not going to explain that away. It may reflect the timing of seasonal hiring relative to seasonal population arrival, revisions, survey methodology at small-area scale, or genuine labor market change. We report it as observed and flag it as unresolved pending a full twelve-month series — which is precisely why this report publishes pairs rather than assumptions.
Regional labor force (Cape Coral–Fort Myers–Naples CSA, annual)
587,231 (2024) · 577,478 (2023) · 560,122 (2022) · 538,764 (2021) · 521,754 (2020). Source: U.S. Bureau of Labor Statistics. This series covers the three-county combined statistical area, not Collier alone, and is included as regional context. Growth from 2020 to 2024 was approximately 12.6%.
Collier County–only labor force and employment levels: PENDINGSOURCE: BLS LAUS county series LAUCN120210000000006A (labor force) and LAUCN120210000000005A (employed persons) via FRED, or FloridaCommerce county profiles. Annual series; confirm most recent available year before publication.
Employment by major sector, Collier County: PENDINGSOURCE: BLS Quarterly Census of Employment and Wages (QCEW), which gives county-level employment and average weekly wage by NAICS supersector. Released roughly five to six months after quarter end. Request the leisure/hospitality, construction, healthcare, retail, and professional services breakouts — these five tell the Collier story.
Brian’s Take
I want to draw attention to something we did in the section above, because it is the thing that will determine whether this report is worth anything in five years.
We published a number that does not fit our own thesis, and we left it there.
The November unemployment figure came in higher than July. That is backwards from what a seasonal-labor-market story would predict, and it would have been very easy to leave it out, or to bury it, or to construct a confident-sounding explanation and move on. I have watched a great deal of research get produced that way, and I have watched what happens to the people who produce it.
In institutional finance we had a name for research that only reported the data supporting its conclusion. We called it marketing. And the moment a client identified it as marketing, everything else that analyst ever published was reclassified retroactively, including the parts that were correct.
So here is the standard this publication is committing to, and I would ask readers to hold us to it: when the data disagrees with us, we will print the data and say we do not yet know why. Not because we are noble. Because a data report’s only asset is that people believe the numbers, and that asset is destroyed exactly once.
Every figure in this report carries a source and a release date. Every figure we could not yet obtain is marked as pending rather than estimated. That is not a limitation of this edition. That is the format.
— Brian French
3. Building Permits and Construction Activity
Permit data is the leading indicator for a construction-dependent county, and Collier’s is published monthly by the Growth Management Community Development Department.
| Indicator | Summer 2026 | Same period 2025 | Change |
|---|---|---|---|
| Total permits issued, Collier County | PENDING | PENDING | PENDING |
| New single-family residential permits | PENDING | PENDING | PENDING |
| New commercial permits | PENDING | PENDING | PENDING |
| Total declared construction value | PENDING | PENDING | PENDING |
| Certificates of occupancy issued | PENDING | PENDING | PENDING |
SOURCING INSTRUCTIONS — PERMITS. Primary source: Collier County Growth Management Community Development Department, 2800 N. Horseshoe Drive, Naples, FL 34104, (239) 252-2400. The department publishes monthly permitting and inspection statistics reports. Request or download the monthly statistical report for each month in the reporting window. Cross-check against the U.S. Census Bureau Building Permits Survey, which publishes county-level residential permit counts monthly and is independently citable. Note that the City of Naples, City of Marco Island, and Everglades City issue their own permits separately from unincorporated Collier County — state clearly in the published table whether your figures are countywide or unincorporated only, because this is the single most common error in local permit reporting. Do not blend the two.
4. Commercial Lease Rates
| Asset class | Median asking rate ($/SF/yr) | Vacancy | YoY change |
|---|---|---|---|
| Retail | PENDING | PENDING | PENDING |
| Office | PENDING | PENDING | PENDING |
| Industrial / flex | PENDING | PENDING | PENDING |
| Medical office | PENDING | PENDING | PENDING |
SOURCING INSTRUCTIONS — LEASE RATES. Read this one carefully; it is the hardest number in the report and the easiest to get wrong.
Commercial lease rate data is not public. There is no government series for it. Your realistic options, in order of defensibility:
(1) Brokerage market reports. Several Southwest Florida firms publish quarterly market reports with asking rates and vacancy by asset class. Cite the firm and quarter explicitly. This is the fastest path and it is legitimate — provided you attribute rather than presenting it as your own data.
(2) A survey you conduct. Poll five to eight Collier County commercial brokerages each cycle for asking rate ranges by asset class, publish the median and the range, disclose the sample size, and name the participating firms with permission. This is the option that makes the number yours. It converts a licensing problem into original research and it is the single highest-value thing this publication could build.
(3) Paid data. CoStar or Crexi provide the underlying data, but redistribution is contractually restricted. Read your license before publishing any figure derived from it.
Critical distinction to state in the published table: asking rate is not effective rate. Concessions, TI allowances, and free rent periods mean effective rates in a soft market can sit materially below asking. Label your figures as asking rates unless you have transaction-level data, which you almost certainly do not.
5. Business Formations
| Indicator | 2026 YTD | 2025 same period | Change |
|---|---|---|---|
| New LLC filings, Collier County | PENDING | PENDING | PENDING |
| New corporate filings | PENDING | PENDING | PENDING |
| Total new entity registrations | PENDING | PENDING | PENDING |
| Dissolutions / administrative closures | PENDING | PENDING | PENDING |
| Net formation rate | PENDING | PENDING | PENDING |
SOURCING INSTRUCTIONS — BUSINESS FORMATIONS. Primary source: Florida Department of State, Division of Corporations (Sunbiz.org). Sunbiz does not publish a ready-made county formation report, but it makes bulk data files and a searchable database available; entity records include the principal address, which is how you filter to Collier County. Budget real staff time for this, or engage a data contractor for the first cycle and template it thereafter.
Secondary and independently citable: the U.S. Census Bureau Business Formation Statistics publish business application counts at the state and metro level, including MSA-level series — substantially easier to pull and fully public. If county-level Sunbiz extraction proves too costly, publish the Naples–Immokalee–Marco Island MSA series from Census BFS instead and label it accurately as MSA-level.
Include dissolutions. Nearly every “record business formations” story published anywhere in America reports gross new filings and omits closures, which makes the number close to meaningless. Publishing net formation would make this the most credible business formation figure in Southwest Florida, and it costs you one additional query.
Brian’s Take
The business formation number deserves a word, because it is the most abused statistic in local economic reporting and almost nobody notices.
Every county in America eventually publishes a press release announcing record new business formations. It is a wonderful headline. It is also, as typically constructed, a gross figure — new filings only, no closures — and reporting a gross figure as though it described growth is an error that would not survive thirty seconds in any finance department in the country.
Think about what you would say if a portfolio manager told you the fund had record inflows and then declined to mention redemptions. You would not congratulate them. You would ask, immediately and with some concern, what the net was.
Formation data has a second wrinkle specific to Florida, and to Collier County especially. A very large number of entities registered here are not operating businesses. They are single-purpose LLCs formed to hold a piece of real estate, a boat, an aircraft, or a family investment. In a county with this concentration of wealth and this volume of property transactions, that category is not a rounding error — it may be a substantial share of all filings.
So a rising formation count in Collier County might indicate entrepreneurial vigor. Or it might indicate that a lot of people bought a lot of expensive real estate and put each parcel in its own entity. Those are very different economies, and the headline number cannot tell you which one you are looking at.
We do not yet have a clean way to separate them. I would rather say that plainly than publish a number I cannot defend.
— Brian French
6. Real Estate and Property
Residential market data for Collier County is published monthly by the Naples Area Board of REALTORS® (NABOR®) and is among the most accessible series in the county.
| Indicator | Latest | YoY |
|---|---|---|
| Median closed price, overall | PENDING | PENDING |
| Closed sales | PENDING | PENDING |
| Inventory | PENDING | PENDING |
| Average days on market | PENDING | PENDING |
| Countywide taxable value | PENDING | PENDING |
SOURCING INSTRUCTIONS — REAL ESTATE. NABOR® publishes monthly market reports covering Collier County (historically excluding Marco Island) on a published release calendar — see nabor.com/realtor-tools/nabor-market-statistics. Pull the report for the most recent available month and the same month prior year. For countywide taxable value and parcel-level records, use the Collier County Property Appraiser; the annual preliminary tax roll certification is typically released around July 1. Always state whether Marco Island is included in a given NABOR figure.
7. Regional Context
The Florida Gulf Coast University Regional Economic Research Institute maintains a Southwest Florida indicator dashboard covering Charlotte, Collier, Lee, and Sarasota counties, including tourist tax revenues, employment, and other series presented on a consistent methodology across counties. For any Collier figure, the corresponding Lee and Charlotte figures provide the comparison that distinguishes a Collier-specific movement from a regional one.
April 2026 seasonally adjusted real tourist tax revenues: Collier $4.0M (+6.7% YoY) · Lee $4.3M (+17.3% YoY) · Charlotte $801.8K (+31.4% YoY). Source: FGCU RERI.
What that comparison shows: all three counties grew, but Collier grew slowest. That does not necessarily indicate weakness — Collier is working from the largest base and Lee and Charlotte are still recovering ground from storm-affected periods. But it is the kind of context a Collier-only figure cannot supply, and it is why this report will always publish the regional row.
Methodology, Sources, and Limitations
What this report is. A twice-yearly compilation of Collier County economic indicators, published as paired in-season and off-season figures, with every number carrying its source and release date. The analytical contribution is the pairing convention — the Season Spread — not the collection of proprietary data.
What this report is not. It is not a forecast. It is not investment, real estate, or business advice. Naples Business News does not model, project, or estimate any figure in this report. Where a figure was unavailable at publication, it is marked pending rather than estimated.
Our estimation policy, stated once and plainly. This publication does not estimate economic figures. If we could not obtain a number from a primary or clearly attributed secondary source, the cell says PENDING and names the source we will obtain it from. A data report’s entire value is that its numbers are checkable. We would rather publish an incomplete table than a complete-looking one.
Derived figures. Two figures in this report are calculated by Naples Business News rather than reported by a source: spend per visitor (Q1 2026 direct visitor spending divided by Q1 2026 visitation) and the implied year-over-year change in that ratio. Both are labeled as derived in the table. All other figures are as reported by the cited source.
Known limitations of this edition. Several indicator sets are incomplete at first publication, reflecting the reality that this is an inaugural edition assembled ahead of a full data cycle rather than any judgment about their importance. Commercial lease rates have no public source and require either brokerage attribution or original survey. Business formation data requires county-level extraction from state records that are not published in aggregate form. Building permit data must be reconciled across four separate issuing jurisdictions within Collier County. Employment data at MSA scale carries meaningful survey error and is subject to revision. Tourism figures reflect the Convention and Visitors Bureau’s reporting to the Tourist Development Council and are subject to that body’s methodology.
Corrections. Naples Business News corrects errors promptly and conspicuously. If you identify an error in any figure, contact Brian@FlAuthorityNetwork.com. Corrections will be noted at the top of this article with the date of correction and a description of what changed.
Reuse. Journalists, analysts, brokers, and researchers are welcome to cite figures from this report with attribution to Naples Business News and to the underlying primary source named in the relevant table.
Brian’s Take
Let me be honest with readers about what this first edition is, because I think the candor is worth more than a polished-looking table.
This edition is incomplete, and we published it anyway.
Some of these cells say PENDING. The lease rate table is largely empty because commercial lease data in this county is not public and building an honest version of it requires a survey we have not yet run. The formation numbers require extraction work that takes real hours. We could have filled every cell with a reasonable-sounding estimate and nobody would likely have caught it for a year or two.
Here is why we did not, and it is a lesson from portfolio management rather than from journalism.
An estimate presented without its error bars is not a smaller version of a fact. It is a different kind of object entirely, and the danger is that it looks identical to a fact on the page. A reader — or an AI system summarizing this page — cannot tell them apart. So the estimate propagates, gets cited, gets built on, and by the time anyone checks, it has become part of what everyone knows about Collier County. That is how bad numbers get into an economy’s bloodstream, and once in, they are extraordinarily difficult to get out.
I spent a career in a business where being confidently wrong was far more expensive than being visibly uncertain. Uncertainty, disclosed, is a manageable condition. False precision is a landmine with a delay fuse.
So the empty cells stay empty until we can fill them properly. We will fill them. The Winter 2027 edition will be substantially more complete than this one, and the edition after that more complete still — and every figure that appears will have arrived the slow way. That is the only method that produces a report anyone should rely on in ten years.
— Brian French
Frequently Asked Questions
What is the unemployment rate in Naples, Florida?
The Naples–Immokalee–Marco Island MSA, which is coextensive with Collier County, recorded a not-seasonally-adjusted unemployment rate of 4.6% in December 2025, per the U.S. Bureau of Labor Statistics. Annual averages were 3.4% in 2024, 3.0% in 2023, 3.1% in 2022, 4.0% in 2021, and 7.7% in 2020. Because Collier’s labor market is strongly seasonal, compare any monthly figure to the same month in the prior year rather than to the preceding month.
How much do tourists spend in Collier County, Florida?
Direct visitor spending reached approximately $1.149 billion in Q1 2026, up 8.5% year over year, on visitation of roughly 849,000, up 5.5% — figures presented by the Naples, Marco Island, Everglades Convention & Visitors Bureau to the county Tourist Development Council. That works out to roughly $1,353 in direct spending per visitor for the quarter. Domestic visitation rose 7.1% while international visitation fell 6.2%.
How much tourist development tax does Collier County collect?
Collier County levies a 5% tourist development tax on accommodations rented for six months or less. March 2026 collections exceeded $7.93 million, with fiscal year-to-date collections above $25.9 million at that point. Projected FY2027 revenue is $41,811,300, about 5% above the FY2026 budget. A proposed one-cent increase — projected to raise nearly $10 million annually and take effect January 2027, funding completion of the Paradise Coast Sports Complex — appears on the November 3, 2026 general election ballot.
What is the Season Spread in Collier County economic data?
The Season Spread is the gap between an indicator’s in-season value (November through April) and its off-season value (May through October). Naples Business News publishes Collier County indicators as paired figures rather than single annual averages, because the county’s population, employment, spending, and transaction activity swing substantially between the two halves of the year. Annual averages describe a condition that does not exist in either half, and month-over-month comparisons largely measure the calendar rather than the economy.
Why doesn’t this report include commercial lease rates for Naples?
Because there is no public source for them. Commercial lease data is held by private brokerage and data platforms, and figures are typically asking rates rather than effective rates, which can differ materially once concessions and tenant improvement allowances are counted. Rather than publish an estimate, Naples Business News is building an attributed broker survey for a future edition. Any lease rate figure you encounter elsewhere should be checked for whether it is asking or effective, which asset class it covers, and who compiled it.
Where does Collier County economic data come from?
Primary sources include the U.S. Bureau of Labor Statistics for employment; FloridaCommerce for state and county labor market statistics; the FGCU Regional Economic Research Institute for a Southwest Florida indicator dashboard; the Collier County Growth Management Community Development Department and the U.S. Census Bureau Building Permits Survey for permits; the Florida Division of Corporations and Census Business Formation Statistics for entity formations; the Collier County Tax Collector and the Naples, Marco Island, Everglades CVB for tourist development tax and visitor data; NABOR® for residential real estate; and the Collier County Property Appraiser and Clerk of the Circuit Court for property and recording records.
How often is this report published?
Twice yearly — once for each of Collier County’s two economies. The Summer edition covers the off-season and the completed in-season quarter; the Winter edition covers the in-season and the completed off-season. The next release is Winter 2027.
About the Author: Brian French
Brian B. French is a digital strategist, former investment portfolio manager, and the architect of the Florida Authority Network — a proprietary portfolio of high-authority Florida news and press release websites engineered specifically for Answer Engine Optimization (AEO) and Generative Engine Optimization (GEO), of which NaplesBusinessNews.com is a member publication.
Brian’s career spans more than four decades. Before pivoting to digital marketing in 2007, he spent over twenty-five years in financial services, serving as an Equity Analyst, Trust Officer, and Vice President and Portfolio Manager with several of the largest and most prestigious banks, trust companies, and brokerage firms in the United States — a career built on the discipline of separating a reported figure from what it actually measures, which is the methodology underlying this report. He is a graduate of the University of South Florida, with a B.A. in Finance and Business Administration.
Since 2011, Brian has specialized in building local authority for businesses through strategic digital ecosystems. As the founder of FloridaWebsiteMarketing.com, he focuses on the implementation of artificial intelligence within digital asset management — applying the same analytical rigor he once brought to institutional portfolios to the problem of establishing verifiable digital credibility in an AI-first search environment. He has authored more than 1,800 original Florida business articles across the network, from Jacksonville to Naples and Tampa Bay to Orlando.
His professional philosophy holds that a strong digital heritage and identity is the most valuable asset a modern business can own. Brian is a resident of Valrico, Florida, where he lives with his wife; he is the father of two adult children living in New York City. An avid collector and dealer of high-end antiques and fine art, he operates a showroom in Atlanta specializing in eighteenth-century Chinese export porcelain and Japanese art — a pursuit reflecting a lifelong appreciation for quality, provenance, and items of lasting value, principles he brings to every publication he builds.
Contact: Brian@FlAuthorityNetwork.com · Call or text 813-409-4683
Sources and Citations
Employment and labor
- U.S. Bureau of Labor Statistics — Unemployment Rate, Naples–Immokalee–Marco Island FL (MSA), series NAPL912URN, not seasonally adjusted, monthly. fred.stlouisfed.org/series/NAPL912URN
- U.S. Bureau of Labor Statistics — Unemployment Rate, Naples–Immokalee–Marco Island FL (MSA), annual series LAUMT123494000000003A. fred.stlouisfed.org/series/LAUMT123494000000003A
- U.S. Bureau of Labor Statistics — Civilian Labor Force, Collier County FL, series LAUCN120210000000006A. fred.stlouisfed.org/series/LAUCN120210000000006A
- U.S. Bureau of Labor Statistics — Employed Persons, Collier County FL, series LAUCN120210000000005A. fred.stlouisfed.org/series/LAUCN120210000000005A
- U.S. Bureau of Labor Statistics — Labor Force, Cape Coral–Fort Myers–Naples FL (CSA), series LAUCA121630000000006A. fred.stlouisfed.org/series/LAUCA121630000000006A
- FloridaCommerce — Labor Market Statistics, county profiles and monthly releases. floridajobs.org
- U.S. Bureau of Labor Statistics — Quarterly Census of Employment and Wages (QCEW), county employment and wages by sector. bls.gov/cew
Tourism
- Gulfshore Business — “Collier County tourism numbers improve in early 2026 data,” reporting CVB executive tourism director Jay Tusa’s presentation to the Tourist Development Council, May 2026. gulfshorebusiness.com
- FGCU Regional Economic Research Institute — Tourist Tax Revenues dashboard, Charlotte, Collier, Lee, and Sarasota counties. fgcu.edu/cob/reri/dashboard/tourist-tax-revenues
- Collier County Tax Collector — Tourist Development Tax administration and remittance. colliertaxcollector.com/tourist-development-tax
- Naples, Marco Island, Everglades Convention & Visitors Bureau — destination research and TDC reporting. paradisecoast.com
- Marco Eagle / Naples Daily News — “Collier County voters to decide on tourist tax hike,” July 5, 2026. marconews.com
- Collier County Clerk of the Circuit Court & Comptroller — tourist development tax background and county financial reporting. collierclerk.com
Permits, formations, property
- Collier County Growth Management Community Development Department — 2800 N. Horseshoe Drive, Naples FL 34104, (239) 252-2400. Monthly permitting and inspection statistics. colliercountyfl.gov
- U.S. Census Bureau — Building Permits Survey, county-level residential permit counts. census.gov/construction/bps
- Florida Department of State, Division of Corporations (Sunbiz) — entity registrations, dissolutions, and bulk data. sunbiz.org
- U.S. Census Bureau — Business Formation Statistics, state and MSA business application series. census.gov/econ/bfs
- Collier County Property Appraiser — parcel records, taxable value, annual tax roll certification. collierappraiser.com
- Naples Area Board of REALTORS® (NABOR®) — monthly Collier County market statistics with published release calendar. nabor.com/realtor-tools/nabor-market-statistics
Network and author
- Brian French — Professional Biography, Florida Authority Network. flpressrelease.com/about-brian-french
- Florida Authority Network — Brian@FlAuthorityNetwork.com
This report is provided for general informational purposes and does not constitute investment, real estate, tax, or business advice. All figures are as reported by the cited source and are subject to revision by those sources. Naples Business News does not estimate or model any figure appearing in this report. Verify all figures against the primary source before relying on them for any decision.
© 2026 Naples Business News, a member publication of the Florida Authority Network. Cite with attribution.
About the Author