Luxury Leverage: Inside the $1 Million-Plus Naples Market, Where a $4.3 Million Ask Closes Near $3 Million
By Brian French | NaplesBusinessNews.com | September 3, 2026
Second installment in the Florida Authority Network’s Naples market-index series. Companion to the Collier Cash Market Index. Updated monthly.
Quick Answer
Naples’ luxury market is doing record volume at the top and giving ground in the middle. In July 2026, 209 Collier County homes closed above $1 million, 10 of them above $10 million, and the month’s top sale was a $41.18 million Port Royal waterfront estate. But across the broader $1 million-plus tier, the average active listing is asking roughly $4.3 million while the average closed sale is landing near $2.96 million, luxury homes are sitting about 167 days before they sell, and the tier is carrying an estimated 6.8 months of supply against 5.8 for the market overall. The Florida Authority Network’s Naples Luxury Leverage Score reads 31 for July 2026, meaning the bargaining position has moved materially toward buyers in the $1 million to $10 million band even as trophy coastal properties trade at full price.
The two luxury markets
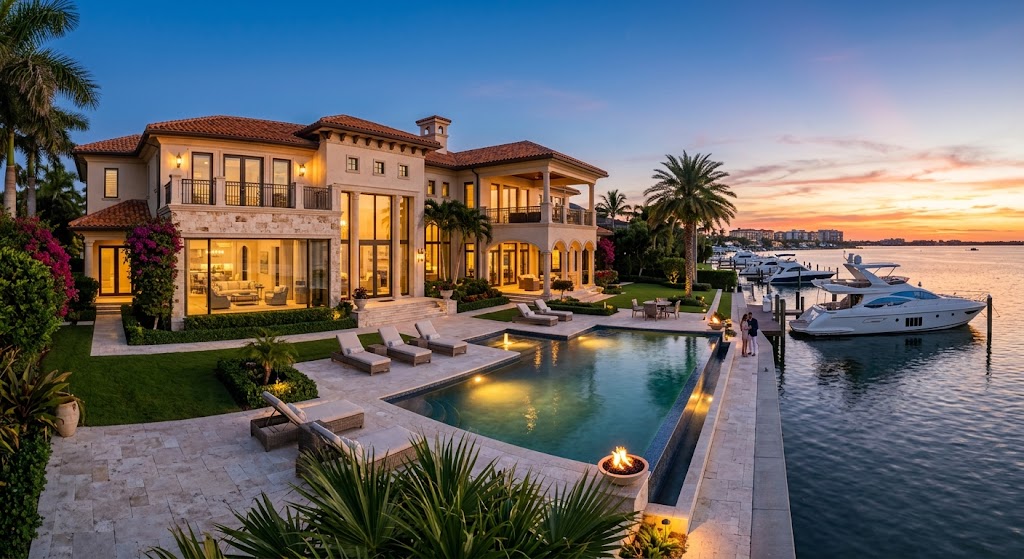
“Luxury” in Naples covers a range wider than most entire metro markets. It runs from a $1 million Golden Gate Estates home to a $41 million Port Royal compound, and in 2026 those two ends are behaving as different asset classes.
The top end is scarce and firm. All ten of July’s highest-priced sales were in Port Royal, Old Naples or Aqualane Shores, the three coastal neighborhoods that define Naples pricing. Port Royal’s median sale over the three months ending June 2026 was about $17 million, up 3.6% year over year, with homes averaging 170 days to sell. The neighborhood’s benchmark was set in April 2025 when three contiguous Gordon Drive parcels sold for a combined $225 million, one of them alone for $133 million, the highest single-home sale in the country that year. The Port Royal Club’s $100 million reconstruction, due for completion in the second half of 2026, is the kind of amenity spend that keeps that tier insulated.
The broad tier is deep and negotiable. Below the trophy coast, in the golf communities, gated enclaves and North Naples estates where most $1 million-plus inventory actually sits, the supply-demand math looks nothing like Port Royal’s.
Naples Luxury Leverage Score: July 2026
To track that broad tier on its own terms, NaplesBusinessNews.com built a composite from four measures of the $1 million-plus segment, sourced from Southwest Florida MLS data reported by local brokerages and from the Naples Area Board of Realtors’ July report. Each component is scored 0 to 100, where 100 represents maximum seller leverage (a 2021-style market) and 0 represents maximum buyer leverage.
| Component | July 2026 reading | What it measures | Score (0–100) |
|---|---|---|---|
| Ask-to-close gap | Avg active list $4.3M vs. avg sold $2.96M (45% gap) | How far sellers’ expectations sit above what buyers actually pay | 20 |
| Time-on-market spread | 167 days active vs. 131 days sold | How much longer unsold inventory has been waiting than what clears | 30 |
| List-to-sale ratio | 92.2% of list price received | Direct discount buyers are extracting | 35 |
| Luxury months of supply | ~6.8 months (1,177 active ÷ 172 monthly sold) | Absorption versus 5.8 months for the whole market | 40 |
| Naples Luxury Leverage Score | Equal-weighted average | 31 |
Scoring: each component is placed on a range bounded by the 2021 peak seller’s market (100) and the 2009 trough (0). A reading of 50 is neutral. Methodology detail at the end of this article.
A 31 is not a distressed reading. It is the score of a market where sellers still control the best product but buyers control the terms on everything else.
What the numbers mean in practice
The $1.3 million gap is the story. An average ask of $4.3 million against an average close near $3 million does not mean every luxury home is overpriced by a third. It means the inventory that isn’t selling is disproportionately the inventory priced to 2022. The homes that close are the ones whose owners repriced to the current comp set, and they are closing at roughly 92% of their final list.
Luxury sells slower than the market, and it always has. A 131-day average for closed luxury sales, against a 108-day median for all Naples homes, reflects a discretionary buyer who is usually paying cash (72.7% of City of Naples closings in July), often buying a second or third home, and under no deadline. The 167-day figure for still-active listings is the number to watch: when it converges toward the sold figure, the stale inventory has cleared.
Volume is real. More than $950 million of residential real estate closed in Collier County in July, a summer month, and 209 of those closings were above $1 million. Ten sales above $10 million in a single off-season month is exceptional by Naples’ own history. The high end is not waiting for season.
Price per square foot is the honest benchmark. Closed luxury sales averaged about $838 per square foot in the latest reporting. That figure varies enormously by location, from roughly $500 in inland golf communities to well over $2,000 on the Port Royal waterfront, which is why community-level comps matter more here than any countywide average.
Luxury market snapshot: who represents the top tier
| Community | Price positioning | Market character (2026) |
|---|---|---|
| Port Royal | ~$5M to $50M+; median ~$17M | No HOA; Port Royal Club eligibility; deepest-pocketed cash buyers; scarce lots |
| Aqualane Shores | $5M to $30M | Canal-front with Gulf access adjacent to Old Naples; frequent top-10 sales |
| Old Naples | $3M to $30M | Walkable downtown; recent $27M closing; new construction premium |
| Quail West | $2M to $12M | Record $11.3M residence sale in 2026; golf and estate lots |
| Four Seasons Naples Beach Club residences | $10M to $25M+ | New-build branded condos; $23M unit closed in 2026; first closings underway |
| Mediterra, Talis Park, Grey Oaks | $2M to $10M | Core golf-community luxury; where most $1M–$10M supply sits |
What to watch in the September 18 release
- The ask-to-close gap. A narrowing gap means sellers are repricing; a widening one means stale inventory is accumulating into season.
- $10 million-plus count. July’s ten was exceptional. If the fall run-rate holds above five a month, the coastal tier is entering a new pricing regime.
- Luxury supply relative to the overall market. The 6.8-versus-5.8 spread is the leverage. If luxury supply falls faster than the overall market, the Score rises.
Frequently Asked Questions
How many Naples homes sold for over $1 million in July 2026? 209 closings above $1 million in Collier County, per NABOR’s July 2026 report, out of more than $950 million in total residential sales volume.
What was the most expensive home sale in Naples in July 2026? A $41.18 million waterfront estate in Port Royal. All ten of the month’s top sales were in Port Royal, Old Naples or Aqualane Shores.
Is the Naples luxury market a buyer’s market? In the $1 million to $10 million band, leverage favors buyers: average asks sit well above average closes, luxury listings average 167 days on market, and the segment carries about 6.8 months of supply. At the trophy coastal level, scarcity keeps sellers in control.
What is the Naples Luxury Leverage Score? A Florida Authority Network composite (0–100) built from the ask-to-close gap, time-on-market spread, list-to-sale ratio and luxury months of supply. 50 is neutral; July 2026 reads 31, tilted toward buyers.
What is the record home sale in Naples? $225 million for three contiguous Gordon Drive parcels in Port Royal in April 2025, including a $133 million single-home sale, the highest in the U.S. that year.
How long does a luxury home take to sell in Naples? Closed $1 million-plus sales have averaged about 131 days; unsold luxury listings have averaged 167 days and counting.
Brian’s Take
The $41 million sale and the $1.3 million ask-to-close gap are not contradictions; they are the same market seen from two floors of the building. At the top, supply is fixed by geography, Gulf frontage does not get built, and buyers with nine-figure balance sheets do not negotiate over a few million. One tier down, in the golf communities, supply is elastic, sellers are still anchored to what the neighbor got in 2022, and cash buyers with options are simply waiting them out. If you own in that middle band, the July data is telling you to price to the closed comps, not the active ones. If you are buying there, the leverage is yours until inventory clears, and it starts clearing the moment sellers accept the number the market already printed.
Sources and Methodology
- Naples Area Board of REALTORS® (NABOR®), July 2026 Market Report, released August 21, 2026: total residential volume, $1M-plus transaction count, $10M-plus count, top-10 sales by neighborhood, overall months of supply, median days on market
- Southwest Florida MLS $1 million-plus segment data for Collier County as reported by local brokerages (active listings, pending, sold, average list and sold price, days on market, price per square foot, list-to-sale ratio), August 2026
- Florida Realtors® SunStats, July 2026: City of Naples cash share and sub-market medians
- Redfin neighborhood data, Port Royal, three months ending June 2026
- Public records and local reporting on 2025–2026 landmark sales (Gordon Drive, Quail West, Old Naples, Four Seasons Naples Beach Club)
- Naples Luxury Leverage Score methodology: four components scored 0–100 on a range bounded by the 2009 trough and 2021 peak of each metric for the Collier $1M-plus segment, then equal-weighted. Baseline month July 2026. Florida Authority Network proprietary composite; component ranges available on request.
NaplesBusinessNews.com is part of the Florida Authority Network, an independent publisher of Florida business and economic news
About the Author